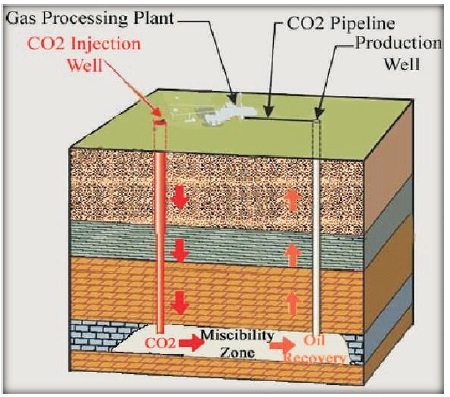
Figure 1. CO2 Gas Injection in the Shale Formation (Jiang & Yang, 2018)
The extent of gas production from shale reservoirs depends heavily on the stress-strain impact on the reservoir. The reservoir's developed stress allows the rocks to fracture naturally. The developed fractures across the reservoir blocks enhance the gas flow from the reservoir towards the wellbore. This review paper provides a comprehensive overview of the technologies and engineering of shale formation permeability behavior and the impact of induced stress and strain. The impacts of stress and strain on the permeability of shale are also studied. This paper presents the effect of stress-strain analysis on gas recovery due to various gas injections, the dependence of gas shale fracture permeability on effective stress and reservoir pressure, analyzing the consequences of various gas injection rates on stress and strain, and the result of stress-strain elongation or variation on hydrocarbon recovery.
Porosity and water penetration are essential components of the reservoir that have a direct impact on shale gas production. Pore factors influence the storage capacity, incident status, and migration power of shale gas from time to time. With the exploitation of shale gas, a decrease in pore pressure throughout the event could contribute to the restoration of the gas with a variety of earth-sized pressures and penetration formations. Water infiltration may be the life cycle of perforated media to allow the flow of fluid, and that is the main parameter of shale gas production capacity (Liang et al., 2021). The body of the gas shale reservoir decreases with increasing pressure, acting as a negative exponential. Gas penetration and effective pressure of gas shale samples are also subject to negative exposure. The penetration of the gas shale reservoir is reduced by increasing the active Date Revised: 30/12/2022 By pressure within the negative exponential (Wang et al., 2020; Yan et al., 2017).
The CO2 injection has been proposed as a promising Exhaust Gas Recirculation (EGR) technology for hastening CH4 desorption by encouraging CO2 adsorption in organic-rich shale systems. While the adsorptions of CH4 and CO2 depend on the conditions of shale formation, CO2 has a higher potential for adsorption than CH4.
Co2 and N2, and C2H6 provide an advanced way for operational companies to increase oil and gas production from solids or solids in water additionally as rare lakes such as sedimentary rocks, solid sand and coal bed methane series (Chalmers & Bustin, 2007). When injected into gas and oil sources, 'powerful solutions' are able to increase integrated production levels and produce long-term economic sustainability throughout the life of the resource (Jiang & Yang, 2018).
A gas injection primarily refers to a circulating gas injection in a liquid form or an injection of N2, CO2, or other gases during recovery (Day et al., 2010; Ao et al., 2017; Zhou et al., 2018). Regardless of which gas is injected, the injection pressure is high due to the low density and pressure of the gas column. Injecting gas into oil reservoirs usually begins by injecting a single gas source. This is followed by a period of closure or immersion to allow the gas to dissolve in the oil, increase its volume, and reduce its viscosity (Chareonsuppanimit et al., 2012). The source is then returned to production, and feedback is monitored. The gas injection system is usually used to open abnormal dams. The CO2 injection process has begun to achieve better resource efficiency with a much lower permissible formulation and an Enhanced Oil Recovery (EOR)-compliant approach that can rule out other major problems related to chronic CO2 emissions, such as the need for CO2 emissions, higher processing costs, and CO2 success (Chen et al., 2015; Ren et al., 2015). Therefore, it is ultimately important to evaluate the effectiveness of the cyclic CO2 injection process, which may reduce the initial success of CO2 and the resulting reservoir fluid. Recent research has shown the need to improve the cyclic CO2 injection process, as shown in Figure 1.
Figure 1. CO2 Gas Injection in the Shale Formation (Jiang & Yang, 2018)
Fracture treatment powered by carbon dioxide or N2 is increasingly being recognized by the increase in good long-term productivity as a result of reducing environmental damage at a small site without the need for large reservoirs (Zhou et al., 2018; Chareonsuppanimit et al., 2012; Chalmers & Bustin, 2007; Scherer, 1986). Additionally, it reduces the normal costs of water transport, cleaning, and dumping.
Enabling decomposable liquids with carbon dioxide or N2 additionally improves the overall flow capacity and level, reduces liquid retention, and reduces the amount of water you need, which can have significant economic impacts (Busch & Gensterblum, 2011; Shi et al., 2008).
Liang et al. (2021) found that shale behaves as a brittle material and exhibits brittle and semi-brittle responses to peak strength loads at different angles of pre-existing bedding during stress compression. For all shale samples, gas permeability increased after failure deformation.
Wang et al. (2020) analyze the high-temperature/highpressure tri-axial testing system of rocks, which is used to study the effect of spontaneous fluid imbibition on the formation mechanism of fracture networks by means of Acoustic Emission (AE) monitoring and ultrasound measurement. After the water–shale interaction, the rock mechanical parameters such as rock strength, elastic modulus, cohesion, and internal friction angle of shales significantly decrease as the imbibition time increases, indicating that the fluid has a strong influence on the mechanical properties of brittle shales.
Yan et al. (2017) have depicted the stress sensitivity of shale, focusing on the influence of confining pressure on shale permeability, but the change in shale permeability during the loading process of axial stress is lacking. The permeability of gas shale during the loading process was tested. The results show that shale damage macroscopically reflects the process of axial micro-crack generation and expansion, and the axial micro-cracks will cause permeability change during the loading process.
Jiang and Yang (2018) present a fully coupled fluid flow and geo-mechanics model to accurately characterize the complex production behaviors of fractured shale gas reservoirs. The flow equations are discretized using a mimetic finite difference method, while the poro- elasticity equations are approximated using a galerkin finite-element method.
Chen et al. (2015) mentions that the correlation between fracture permeability and effective stress is established for gas shales through theoretical derivation. This model is able to match the permeability data for different gas shales. The matching results for the gas shale studied show that the model coefficient, fracture compressibility, which decreases as initial shale permeability increases, is strongly affected by the flow directions and varies with the shale's mineralogical composition.
Computer Modeling Group (CMG) Imitation Exploitation 2018 paper aimed at finding the total amount of injection and predicting the most appropriate gas for injection purposes. N2 or CO2 is injected at standard pressures and various crustal stresses. The changes in pressure along the briquette and the concentration of the gas mixture flowing out of the briquette were analyzed. The gas injection system consists of cylinders, a compression system, control valves, and a pipeline. The control valves are the main valve and the pressure-relief valve. The main valve displays the tank pressure. The pressure-relief valve is used to control injection pressure. The maximum output pressure can be increased to a certain level. Therefore, it will mimic completely different gases and injection levels and support the results we have achieved so that we can conclude the results (Wang et al., 2014; Zhou et al., 2013).
The stress-strain analysis explains how injection and production processes are interrelated. For the simulation in the later part, we collected all the necessary data from these papers. The different injection gas compositions of CO2 and N2 and different injection starting times, and the results show that gas injection yields incremental production, whatever the composition of the injected gas. The data gathered is extremely useful in running the simulation and obtaining the results (Agarwal & Kudapa, 2022a; Agarwal & Kudapa, 2022b).
The reservoir actual size is 3000m * 900m and the depth of the reservoir is 5460m. The grid (I, J, K) is (20, 9, 6) delta x and delta y are (41m, 38m), with the producer well, and the grid is illustrated in Figure 2 (Ranjith et al., 2019).
The thickness, porosity, and permeability of each layer are illustrated in Table 1 (Day et al., 2008; Anggara et al., 2014). In this, reservoir properties such as porosity, permeability, and thickness are considered. All the belowmentioned assumed parameters are entered into the CMG Simulator under the reservoir properties section, with the thickness in meters, porosity in fractions or decimals, and permeability in md all tabulated as the reservoir rock properties.
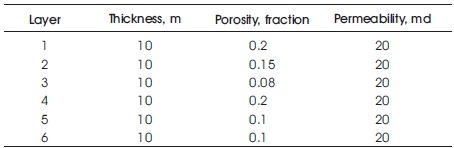
Table 1. Properties of Each Layer of the Shale Formations
Under the components portion, data regarding the fluid type and its composition are considered and mentioned in Table 2. Here the component name with the reference phase, critical temperature in Fahrenheit, critical pressure in psi, and the molecular weight in lb/lb mole are all tabulated with comparisons of water, dead oil and CO2 (Chen et al., 2015).
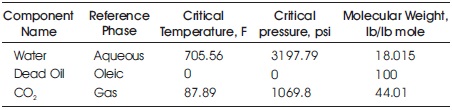
Table 2. Properties of the Different Components used in CMG
A relative permeability curve variation study is very important to estimate the saturation variation across the reservoir during hydrocarbon production (Pan & Connell, 2007; Pan & Connell, 2012). The data for calculating the variations in relative permeability are mentioned in Table 3. The relative permeability curves can be observed in Figure 2.
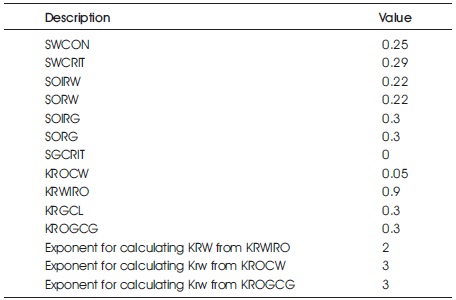
Table 3. The Reservoir Relative Permeability and Capillary Pressure
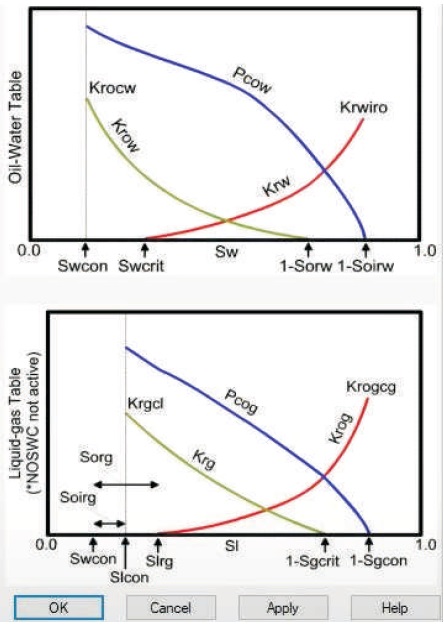
Figure 2. Relative Permeability of Oil - Liquid - Gas
The injection and production wells are created for the reservoir to produce and for the injection of required gases into the wells (Day et al., 2010; Ao et al., 2017). A few parameters listed in Table 4 must be maintained in the injection well in order to inject required fluids or gases, and the data parameters listed in Table 4 must also be considered when producing well bores.
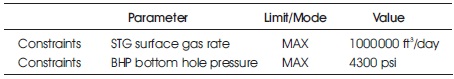
Table 4. Creating the Injection Well Data
Injection well data is used to generate production well data, with the single constraint that the Max mode and value are both 2000 psi. These values are consolidated and tabulated in Table 5.

Table 5. Creating the Production Well Data
For maintaining connectivity between the reservoir and the wellbore, the casing string needs to be perforated, allowing the reservoir fluid to enter the wellbore and reach the surface production facilities (Agarwal & Kudapa, 2022c; Dora et al., 2022). In CMG, the casing is perforated in the below-mentioned block address as shown in Table 6.

Table 6. Perforation of Well from Layer 1 to Layer 6
The permeability of the shale reservoir decreases with increasing effective stress according to the negative exponential function. The change in effective stress was simulated by increasing the effective confining pressure of shale, and the change in permeability of shale samples with changing effective confining pressure was measured.
Figure 3 shows the graph of the daily gas rate production of CO2. In Figure 3, the daily production of gas increases with the injection of CO2 until saturation is reached. Considering the graph for production, in the initial phase it heaves into the higher value and stands still with the same, and it does not come down from the higher value.
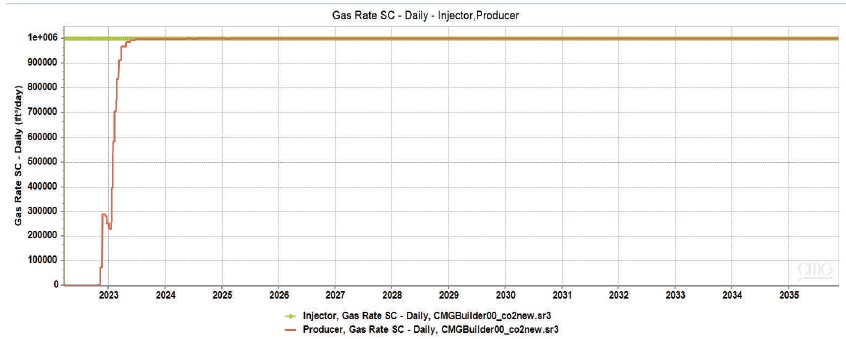
Figure 3. Graph of Daily Gas Rate Production of CO2
Once saturation is reached, there will be no further increase in the daily production (Kudapa et al., 2017a; Kudapa et al., 2017b). The graph of cumulative gas saturation of CO2, as shown in Figure 4, is drawn for the injector and the producer gas rate. Considering the graph for those values, it leads to a peak value. When it reached a certain value, it maintained that value until the end. The producer and injector are mentioned in the sidelined figure.
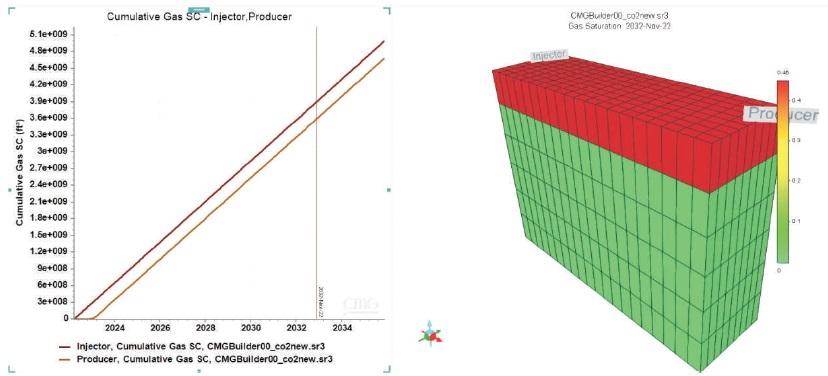
Figure 4. Graph of Cumulative Gas Saturation of CO2
The cumulative gas production graph shows that the rate of oil production increases steadily until a point called saturation, after which it can be seen that there is no change in rate of production. After saturation, the production rate remains constant, and there is the steady increase in production mentioned in Figure 4. (Kudapa et al., 2017b; Kudapa et al., 2018).
Following the discussion of CO2, consider that C2H6 stands for ethane, and the graph in Figure 5 depicts the daily gas rate production of C2H6. Considering the graph for those values, initially it leads to a lower value, raises to a certain value, and then leads to the peak value. Once it attained a particular value, it kept on with the same value till the end.
Figure 5 depicts the above graph, which shows that the daily production of gas increases with C2H6 injection until saturation is reached. Once saturation is reached, there will be no further increase in the daily production (Kudapa et al., 2017b). The graph of cumulative gas production of C2H6 is shown in Figure 6.
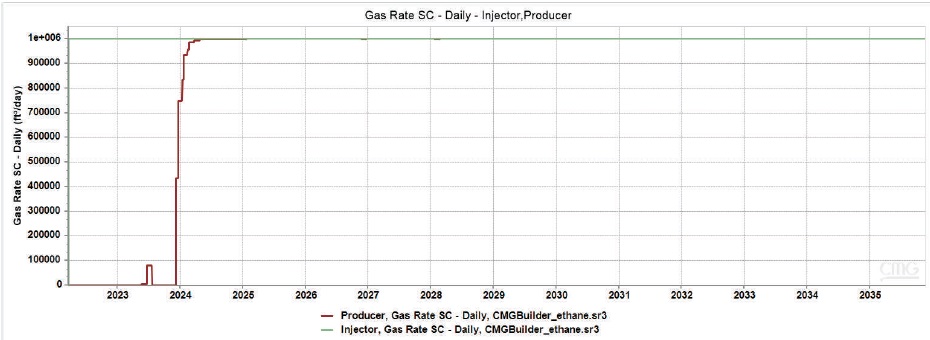
Figure 5. Graph for Daily Gas Rate Production of C2H6
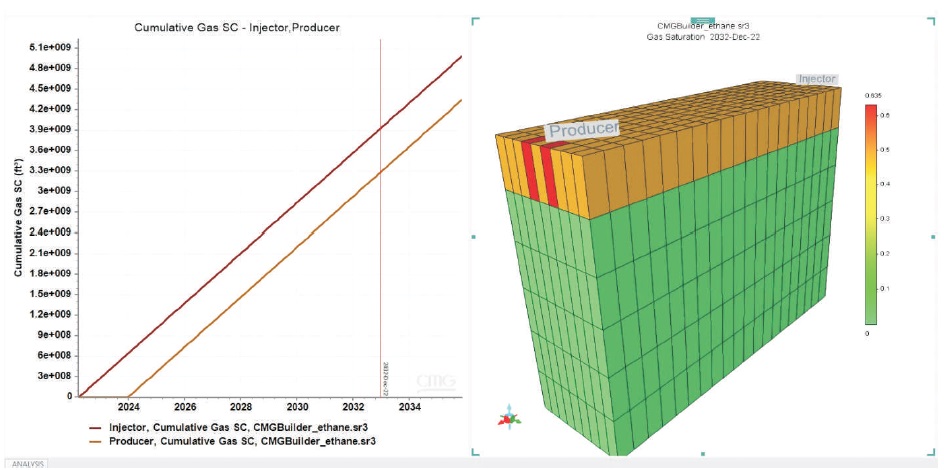
Figure 6. Graph of Cumulative Gas Production of C2H6
The cumulative gas production graph shows that the rate of oil production increases steadily until a point called saturation, after which it can be seen that there is no change in rate of production. After saturation, the production rate remains constant, and there is a steady increase in production as shown in Figure 6 (Agarwal & Kudapa, 2022b; Kudapa et al., 2017b).
Following the discussion of CO2 and C2H6, remembering that N stands for nitrogen and the graph depicted in Figure 7 is for the daily gas rate production of N2. Considering the graph for those values, starting with a lower value and raising it to a certain value and then keeping on increasing leads to the peak value. Once it attained a particular value, it kept on with the same value till the end.
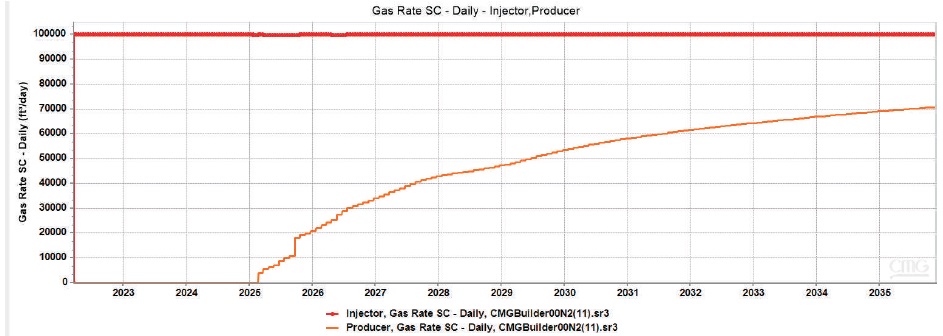
Figure 7. Graph of Daily Gas Production Rate of N2
The cumulative gas production of N2 graph shows that the rate of oil production increases steadily until a point called saturation. After saturation, the production rate remains constant and there is a steady increase in production as shown in Figure 8 (Scherer, 1986; Kudapa et al., 2017a). The producer and injector are mentioned in the sidelined figure, with the initial graph mentioned by the injector and another graph for the producer.
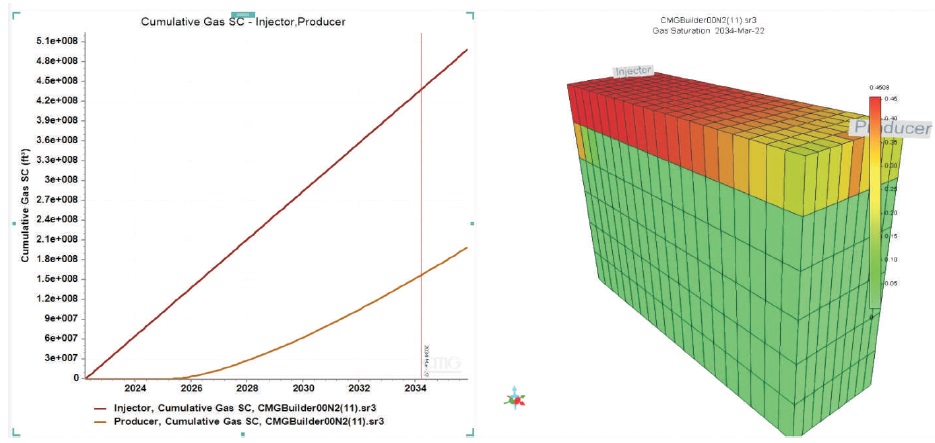
Figure 8. Cumulative Gas Production of N2
Considering all the graphs from Figures 3, 5, and 7, the values obtained for the daily gas production of CO2, C2H6 and the N2, the peak values are all the same, but the initial and middle values are changing with each other. After examining all of the graphs in Figures 4, 6, and 8, the values obtained for cumulative gas production of CO2, C2H6, and N are all the same for three of them with a range of most peak values, but the initial and middle values change with the starting point with each other, as well as the injector and producer values.
When CO2 is injected in a shale formation, the production of gas increases with the increase in the injected pressure of the gas. As the saturation point is reached, the production does not change much. Also, initially no change is seen in the recovery as, for some period of time, gas is absorbed in the formation and doesn't alter the production or pressure of the formation.
Firstly, the injection fluid volume under reservoir conditions was selected as a comparison index for the injectivity to evaluate the EOR effect of different fluids. From the comparison, it can be seen that the injectivity of N2 is the highest among the three fluids, but its impact on EOR is the least. CO2 has the best secondary injectivity for Enhanced Oil Recovery (EOR). The injected volume of C2H6 is the least, but with a moderate oil recovery.
CO2 has more advantages over C2H6 and N2 in tight reservoirs. Through the EOR mechanism analysis, CO2 is the only fluid that is miscible with oil. In contrast, N2 mainly exists in the gas phase and is much less soluble in the oil phase compared to CO2. However, it still has a certain swelling effect on crude oil. C2H6 does not easily dissolve in the oil and water and mainly enhances oil recovery through capillary force, gravity, and elasticity displacement.